During my graduation project for the MSc. Design for Interaction, I developed an evaluation process for family exhibitions in the Maritime Museum Rotterdam. The goal of the project was to collect honest and useful feedback from visitors of immersive exhibitions, while influencing the flow of the visit as little as possible.
The final design contained a process poster showing all steps of the evaluation process accompanied by an instruction manual explaining how to conduct these steps. The method makes use of a physical tool; the tracking device. As part of this project I prototyped this device and the visualization software that is used with it.
Design direction: The enjoyment heat-map
It was decided to build an evaluation process around the concept of a heat-map which shows what areas of the exhibition visitors do or don’t like.
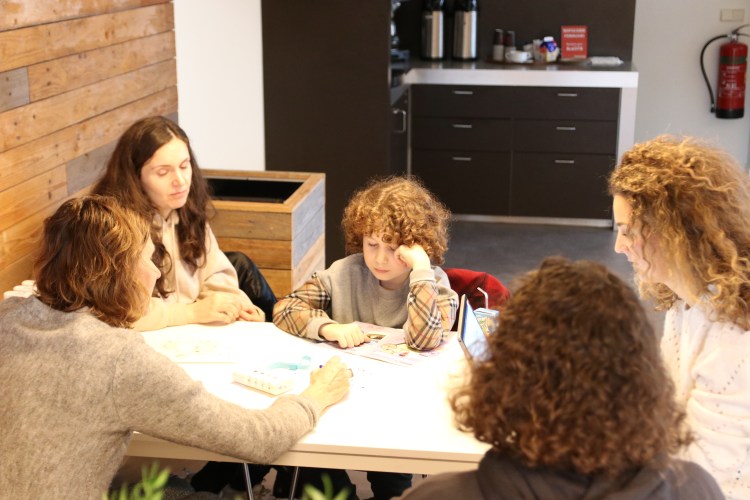
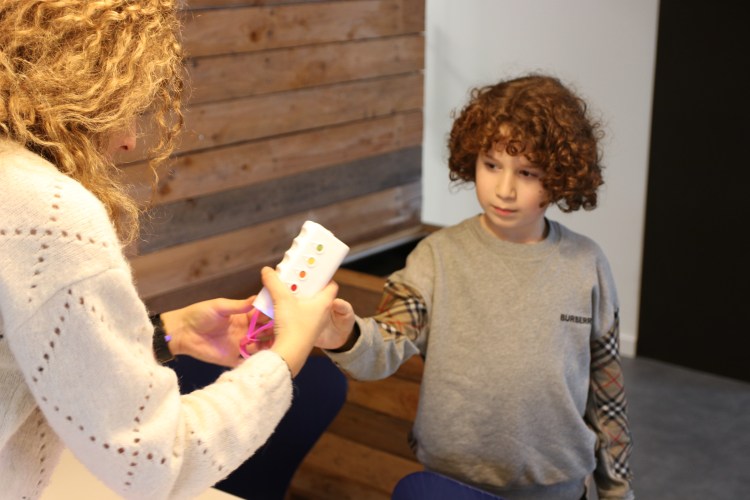
To create this heat-map, visitors take along a special developed tracking device during their exhibition visit. The device will vibrate every minute. At this moment, the visitors can give a small sample of feedback about how much they like what they are doing or seeing at that moment. They do this by pressing a smiley on the device. The device also keeps track of the location of the visitors. From this data, a visualization as shown in the image below can be created. The visualization is showing the route of the visitors (the line), the amount of time they spent at a certain location (the thickness of the line) and the given feedback samples (the colored dots).

The complete evaluation process
The heat-map and its creation is just a part of the evaluation process. To give a clear overview of all steps of the evaluation, a framework of the complete evaluation process was created and turned into a poster. This poster is shown below. On the poster, two tracks for the evaluation are distinguished.
During one track, called version 1, the route and feedback samples of over a hundred visitors is collected. An interactive stand will ask automated questions based on this data. During the other track, called version 2, the route and feedback of only twenty visitors is recorded. A heat-map is created for every visitor and based on this heat-map an interview is held with the visitors.
For this project, I decided to focus on the second track, version 2. I developed an instruction manual containing all information needed to conduct the steps of this version of the evaluation. It for example explains how to conduct an interview based on a heat-map and contains information on how to process the data gathered form these interviews.

The physical prototype
I needed to create a prototype of the tracking device to test and validate the concept of the evaluation method. Before I was able to create the final prototype, I first had to find out what characteristic the portable tracking device should meet to collect the data needed to create a heat-map. Therefore several prototypes were created and various tests were conducted.
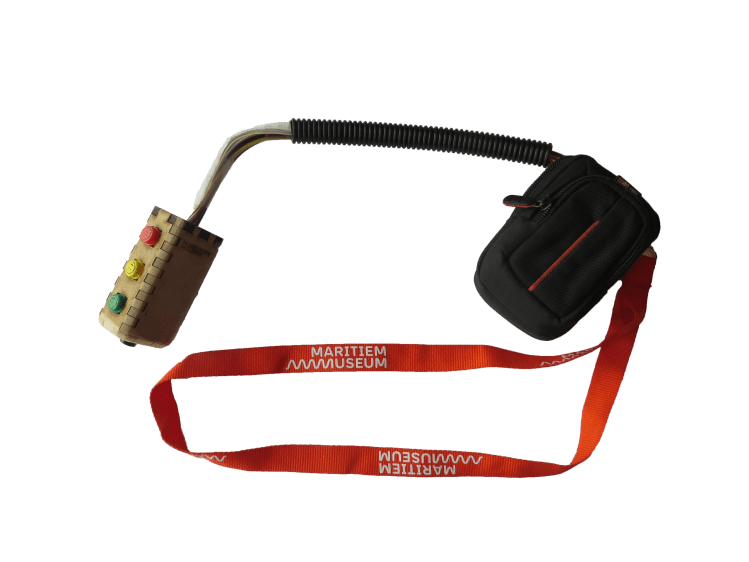
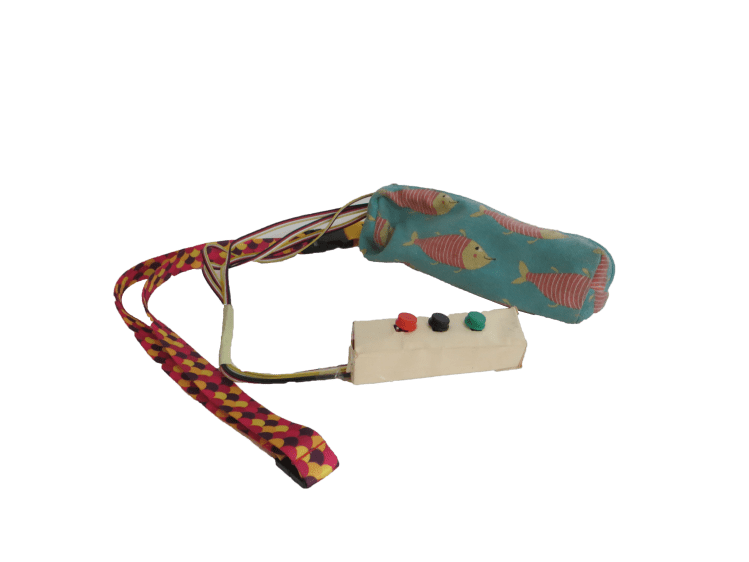
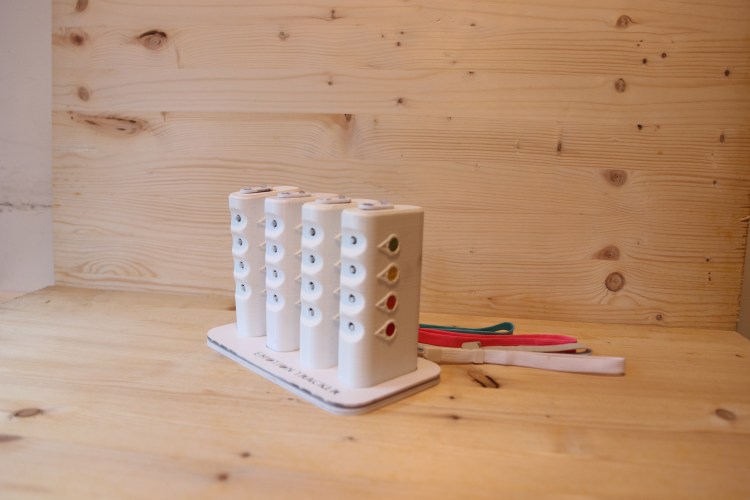
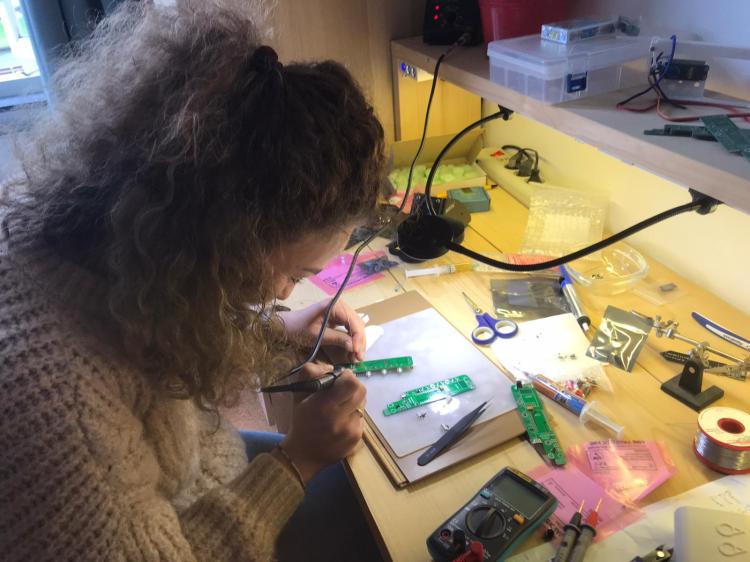
After testing the prototypes and figuring out the needed characteristics, the final prototype was made. The housing was made by 3D printing. I created a code to make the Arduino’s in the prototype function and a friend helped me to create the PCBs for the devices.


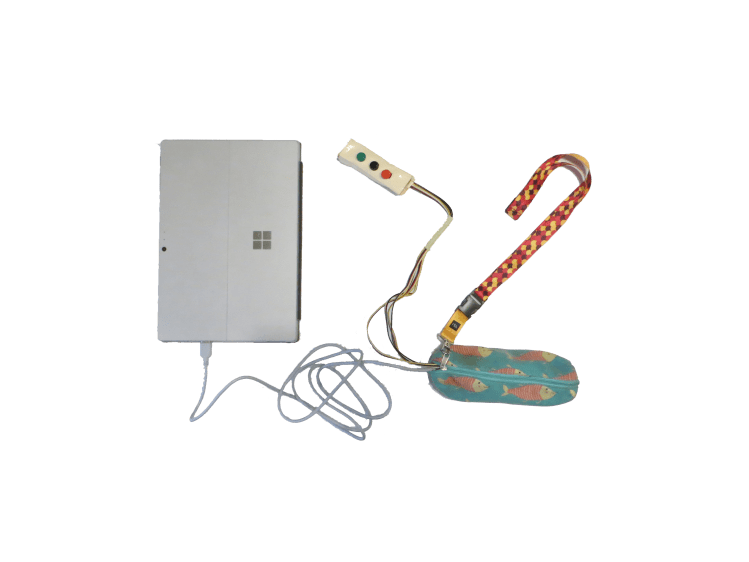
To visualize the information that was collected by the tracking device, I created a visualization program using p5.js. p5.js is a JavaScript library for creative coding. By making use of an nrf24l01 module, a connection between the tracking device and the p5.js sketch was established.
When using this final prototype to create the heat-map, the route of the visitor still had to be indicated by hand by drawing a line on a digital map in the p5.js sketch. When the line isn’t drawn further for a while, the line gets thicker to indicate that the visitor stayed at that point for a longer time. When a visitor presses a button on the tracking device, a colored circle corresponding to this button is drawn on the map automatically.

Testing the concept
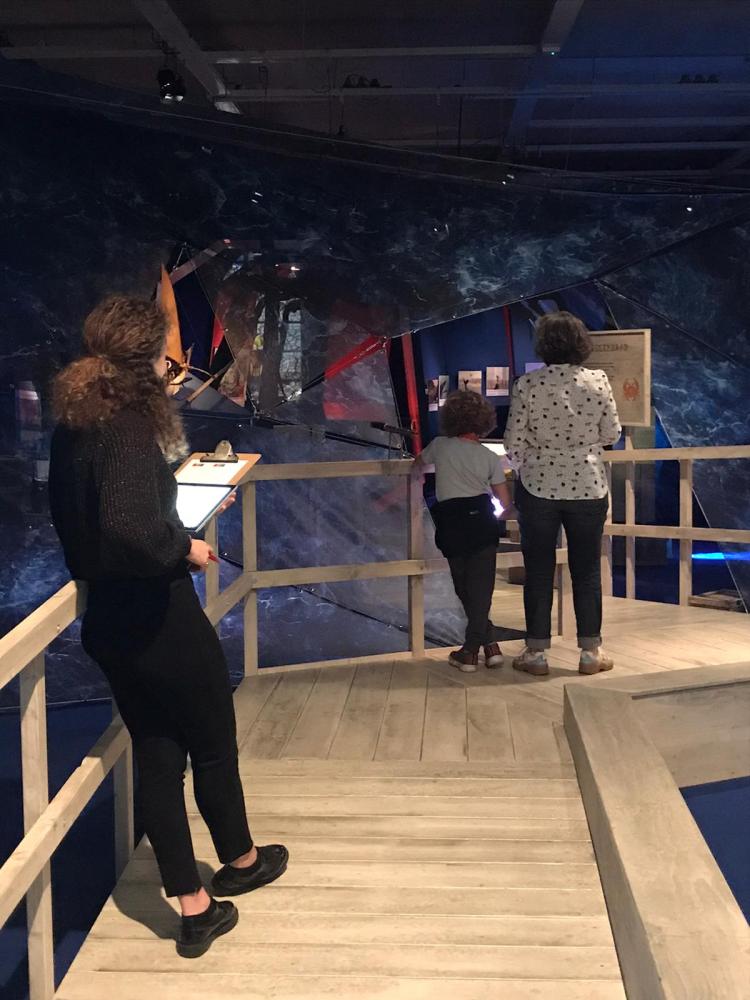
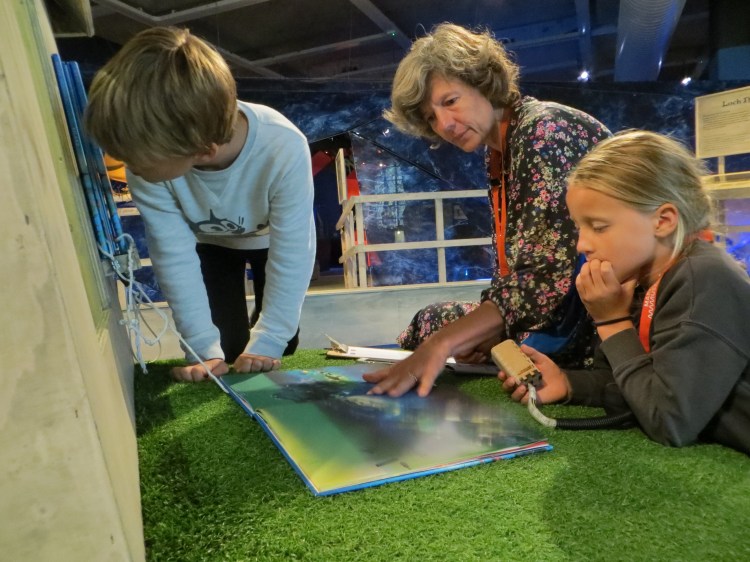
To validate the concept of the evaluation method, several tests were conducted. The heat-map turned out to be very useful to base the interview upon. It immediately arose reactions among the visitors which gave interesting insights in the user-experience of the visitors.